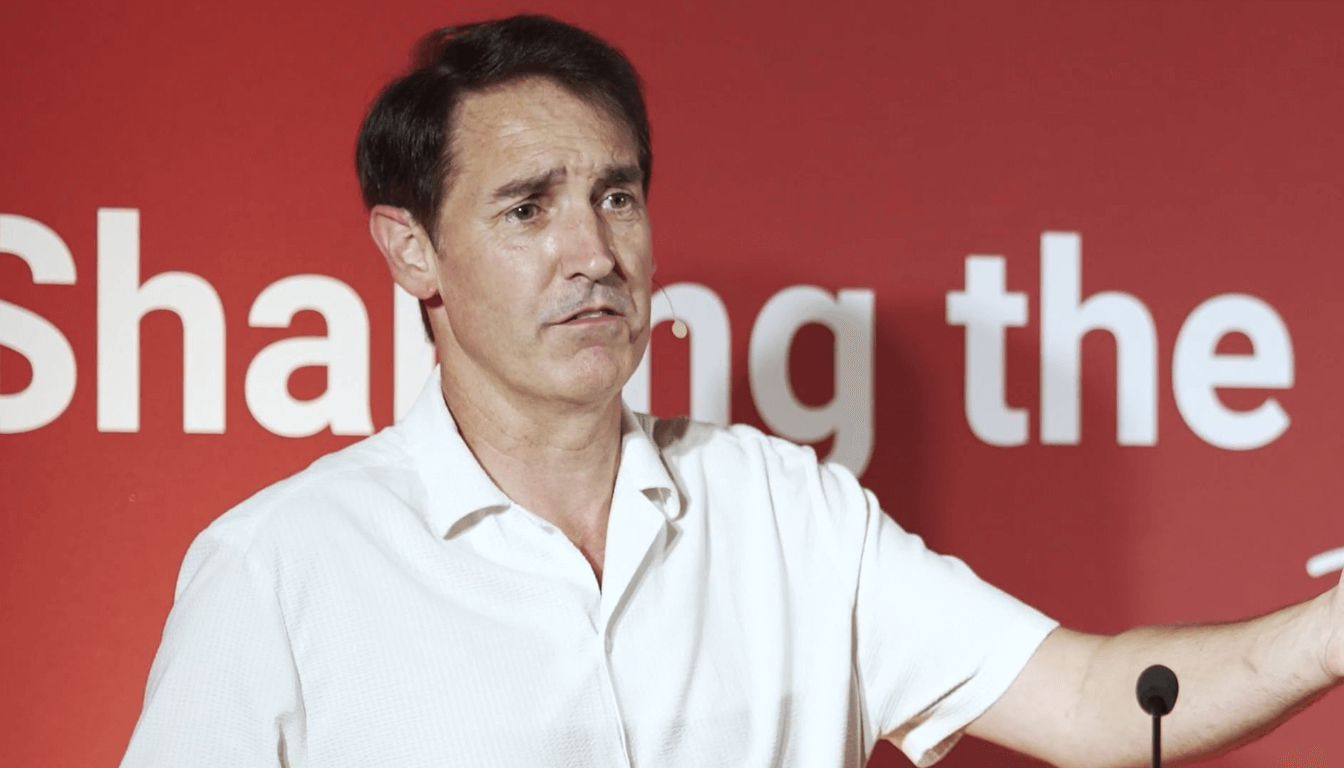
When Andrew Roberts stepped up at the HMO Summit 2025 he did something valuable and rare: he used data to reframe opportunity. The headline he left the room with was simple,change equals opportunity,but the detail matters. Interest-rate signals, tenancy lengths, city-by-city yield variation, regulatory pressure and tenant affordability together paint a market that is not broken; it is evolving. For operators who understand the signals and build the right playbook, the next three years could be the most profitable window in a decade.
Below I take Andrew’s talk and turn it into a long-form, practitioner-friendly guide: what he said, what the numbers mean, and,crucially,what you should do with this information.
Interest rates, SONIA and why you should watch the United States
Andrew began with the one economic variable that touches every HMO business: interest rates. He reminded the audience of a pattern that operators often forget in the day-to-day: UK mortgage and funding costs tend to follow US rate moves with a lag. That’s not political commentary; it’s a historical pattern in global capital markets. Practically, this means that if you only watch the Bank of England announcements you’ll often be reacting late.
A more immediate market signal is the SONIA curve: short-term rates traded in money markets. At the Summit Andrew highlighted a SONIA-implied market expectation of rates falling toward the mid-to-high 3% range over the next few years,specifically, near 3.5% for a two-year horizon and around 3.6% over five years. The implication for operators is twofold. First, mortgage costs are not likely to rocket further from current levels in a sustained way; second, timing still matters. If you are planning to refinance or fix debt, a sensible strategy is to watch the SONIA and US rate moves as part of your decision matrix rather than relying solely on the Bank of England calendar.
But there is a caution: markets can re-price quickly if inflation surprises. Andrew’s point about inflation is practical rather than academic: inflation drives repair and conversion costs and determines tenants’ wage growth, which in turn affects affordability. Even if headline inflation drifts toward the Bank’s 2% goal, pockets of cost inflation (materials, labour) can keep refurbishment and running costs stubbornly high. So build sensitivity into budgets: assume slightly higher project cost run-rates than pre-2020 planning would have allowed.
Demand is growing,but it’s a changing kind of demand
One of the talk’s most important claims was that HMO demand is rising. Andrew cited a year-on-year increase in HMO room demand of roughly 12% and an increase in average tenancy length,from about 12 to 14.2 months (the talk quoted an average of 14.2 months). Those two numbers together tell a clear story: tenants are, on average, staying longer and more people are choosing HMOs over single-occupancy flats for affordability reasons.
Why is this happening? At a macro level the combination of slow wage growth (relative to housing cost) and a tight supply of affordable alternatives is nudging cohorts,young professionals, graduate workers, students and others,toward shared living. This is not “trading down” in a derogatory sense; it is a pragmatic decision to maintain quality of life while saving toward a deposit or managing career mobility. For operators, the implication is direct: better-quality, community-minded HMOs that offer convenience and sympathetic design will capture this structurally growing tenant pool.
Tenancy length and the economics of staying put
A tenancy that averages 14 months rather than 12 months may sound like a small change,but the economics are not linear. Every avoided void saves you not only lost rent but also the fixture-and-fittings refresh cost and the marketing and agent fees of re-letting. Andrew’s data suggesting that average HMO tenancy length is moving north is a strong signal that tenants are more likely to stay if you build the right product.
But the right product is not only physical space; it is also the operating promise. Operators who target longer-term tenants (professionals, those saving for home ownership, certain categories of public-sector staff) tend to see lower arrears and higher retention. Andrew gave the example of a client who targets tenants whose profile indicates they are moving toward homeownership: groups of professionals, people with cars (a proxy in some markets for future mobility and stability), and rigorous credit referencing. That client reported virtually zero arrears over eight years,not a magic trick, but a strategy aligned to tenant lifetime value.
Hard numbers: stock, for-sale inventory and company ownership
Andrew quoted a national stock figure of approximately 362,000 registered HMOs across England and Wales (note: he explicitly excluded Scotland for that dataset) and pointed out that around 87,000 HMOs were on the market. Those are big numbers. A large absolute count of HMOs for sale can indicate churn and fear on one side of the market and opportunity on the other. Andrew suggested that the current exit wave is partially driven by regulatory fear and uncertainty,a natural reaction to prospective major changes such as Renters’ Reform,and that fear creates room for well-capitalised, compliant operators to expand.
Another datapoint Andrew raised is company ownership: roughly 24% of HMOs are held in companies. That prompts an operational question many landlords now ask: is it tax-efficient or professionally prudent to hold assets in a company structure? There’s no one-size-fits-all answer, but the observation is important because it shows structural change in ownership patterns that differentially benefits investors depending on tax and financing strategies.
Regulation: tightening compliance and renters’ reform
Andrew emphasised regulatory momentum. The Renters’ Reform Bill,expected (as of his talk) in the last quarter of the year,looms large because abolition of Section 21 and other potential changes create legal and operational uncertainty. At the same time, local authorities are beefing up enforcement of decent-home standards and expanding selective licensing and additional HMO licensing in a growing number of towns and cities (he mentioned places such as Camden, Manchester and Oxford among those tightening rules). Councils are also scrutinising physical compliance more strictly than they have historically; Andrew recounted instances where sink sizes and bathroom layouts required redesigns to meet local HMO specifications.
The operational takeaway is straightforward. Compliance is now non-negotiable, and costs for non-compliance are rising. For investors that means two things: first, be disciplined about pre-purchase due diligence for council-specific HMO rules; second, maintain higher service and record-keeping standards so your homes are not caught out by inspection-led costs.
Yields vary dramatically by city,the northeast advantage and the 5–6 bedroom sweet spot
Andrew walked the audience through city-level yield differences. Using auction sales data and platform analytics, he highlighted that the highest yields are concentrated in the northeast of England,a region that, according to the datasets he referenced, outperforms much of the south on pure yield metrics. At the mic he illustrated how a hypothetical property with a monthly HMO income of £1,518 and a purchase price of £156,000 produces roughly an 11.6% gross yield by the common formula (annual rent divided by purchase price). That figure is illustrative of what good HMO arithmetic can deliver in the right market.
He also flagged a practical pattern: larger HMOs (five- to six-bedroom configurations) tend to secure better yields than smaller three- or four-bedroom properties. That dynamic is driven by scale efficiency: the incremental rent from additional bedrooms outruns the incremental uplift in management and conversion costs in many markets. Andrew’s pragmatic advice was to avoid buying averages; instead, look for properties you can add value to and where the expected return-on-time and return-on-effort justify the deal.
Return on time and return on effort,an operator’s secret metric
One of the talk’s most useful takeaways was a conceptual nudge away from yield fetishism toward operator-centric logic: return on time and return on effort. Two deals might show similar headline yields on paper, but if one requires a six-month project and the other three months, the effective return for the operator changes dramatically. Andrew urged listeners to model not only the yield but also the calendar and effort intensity of each conversion.
This creates a pragmatic decision framework. If Deal A yields 12% but consumes twelve months of intense founder time and large capex outlay, and Deal B yields 10% but can be turned in three months with subcontracted work and minimal founder effort, Deal B might deliver superior compounded cashflow and faster capital recycling. Build a simple decision matrix for each opportunity that captures months-to-complete, founder-time requirement, likelihood of planning delay, expected void length, and capex risk. Then normalise returns by time to compare apples with apples.
Urban centers, quality upgrades and tenant targeting
Andrew’s sectoral recommendation was clear: urban centres are where growth and demand are concentrated. Rural properties and some commuter towns can underperform because local demand for shared living and professional co-living is weaker. Within urban markets, the path to out-performance is product-led. Upgrading quality to high-spec co-living,better kitchens, robust communal spaces, and high-standard fixtures,attracts tenants who are prepared to stay longer and pay for predictable standards.
Further, deliberate tenant targeting pays off. Andrew described a client grouping professional cohorts,nurses, engineers, police,into houses where residents shared life stage and ambitions. That client’s careful targeting and rigorous referencing drove near-zero arrears and strong retention. That’s the economics of alignment: when residents’ expectations align with the product and with each other, management burden drops and lifetime tenant value rises.
Opportunity: commercial-to-residential conversions
A technical and timely suggestion Andrew made was to look at commercial-to-residential conversions, particularly as office markets are recalibrating post-Covid and some commercial stock is being sold at discounts. He argued that converting underused or cheaply priced commercial buildings into HMOs can produce outsized returns relative to traditional residential deals because the purchase price basis can be significantly lower and conversion to multiple lettable rooms compounds rent.
That strategy is not plug-and-play. It requires savvy planning, a checklist for change-of-use, an understanding of building regs and fire-safety compliance, and often liaison with local authorities. But where you can manage those risks, commercial-to-HMO plays can deliver “double returns”,gains from both the low entry price and the higher per-room rental yield.
Practical next steps for operators (how to use Andrew’s data-driven view)
If you take Andrew’s talk as a briefing, here is how to act on it:
Begin by monitoring three market signals daily or weekly: the SONIA curve (for funding signals), local HMO demand indices (platform data or Coho dashboards if available), and council licensing updates for areas you operate in. Use those signals to inform whether to buy, hold, or sell within the coming quarter.
Second, normalise every deal for return on time and return on effort before you sign. Build a simple spreadsheet that divides expected net yield by estimated project months and founder days. That will prevent you from overpaying for “headline” yield that costs too much to realise.
Third, lean into urban, 5–6 bedroom opportunities where your operating model can scale. These often provide the best compromise between rent and conversion effort. But be rigorous with council rules: local licensing and decent-home standards are tightening and the cost of non-compliance is real.
Fourth, target tenant profiles intentionally. Where possible, build homes for professionals or cohorts with demonstrable stability,the small extra effort in targeted marketing and better referencing can eliminate arrears and reduce churn.
Lastly, prepare for the regulatory change curve. Speak with solicitors and policy-savvy advisors (Andrew recommended following specialists like Julie Ford in the talk) and ensure your compliance reporting and record keeping are audit-ready. If others are running scared and selling, your readiness is your advantage.
The strategic summary: adapt, measure, out-execute
Andrew’s message was optimistic in a wry, practical way. The HMO market is not in terminal decline; it is shifting. Interest rates show a path to lower funding costs in the medium term, tenant demand for shared living is rising, tenancy lengths are increasing, and city-level yields show opportunities if you pick the right areas and the right property types. At the same time, regulation is tightening and compliance costs are real. The winners will be operators who measure more than yield (they’ll measure time, effort and matched tenancy lifetime value), who design homes for the tenant cohorts that are growing, and who can execute conversions and management at scale while staying compliant.

